What we do differently
Simple, clean user interface with no annoying ads
We think banners and unrequested video ads (with sound blasting even on silent) ruin user experience.
To keep the app free without impacting the user experience we show ads only when you ask. (by clicking Watch video ad)
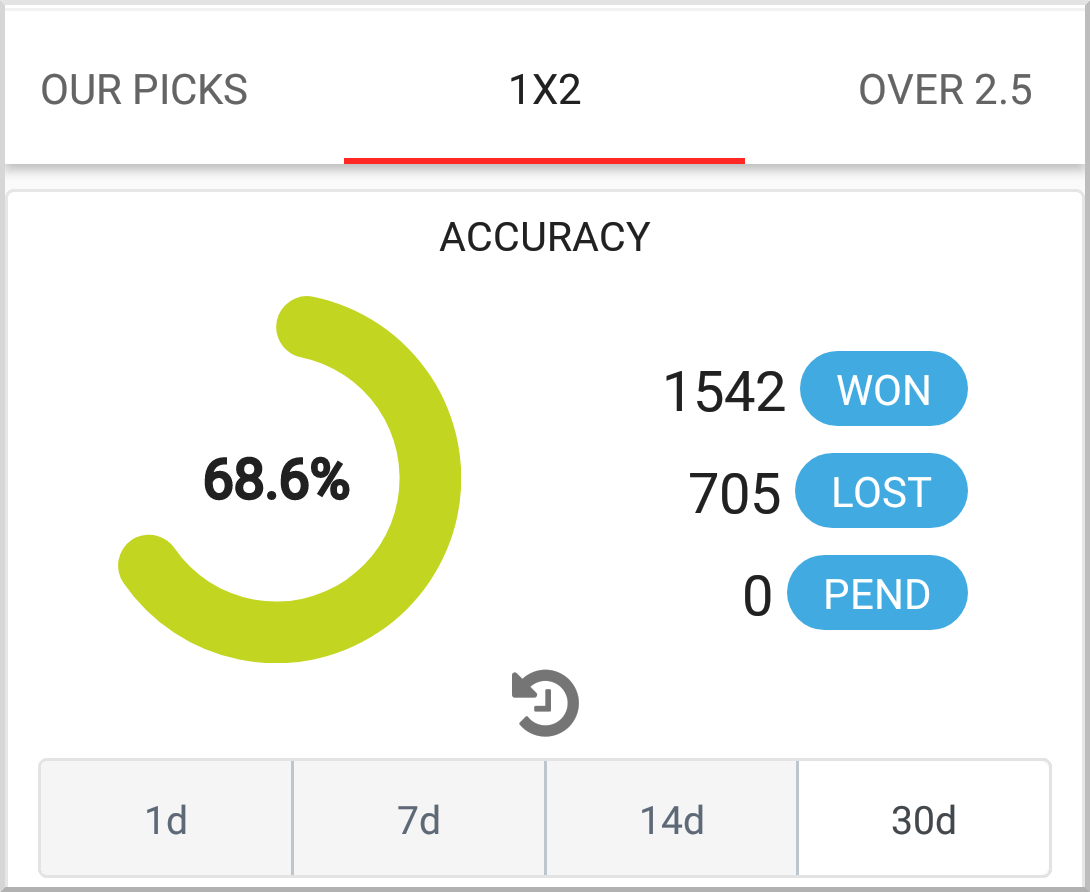
Quickly determine the performance of a market
Each prediction tab contains a widget that allows you to quickly measure the accuracy for the past day, week(s) and month.
To measure performance you need to look at more than 150 - 200 matches to leave luck out of the equation.
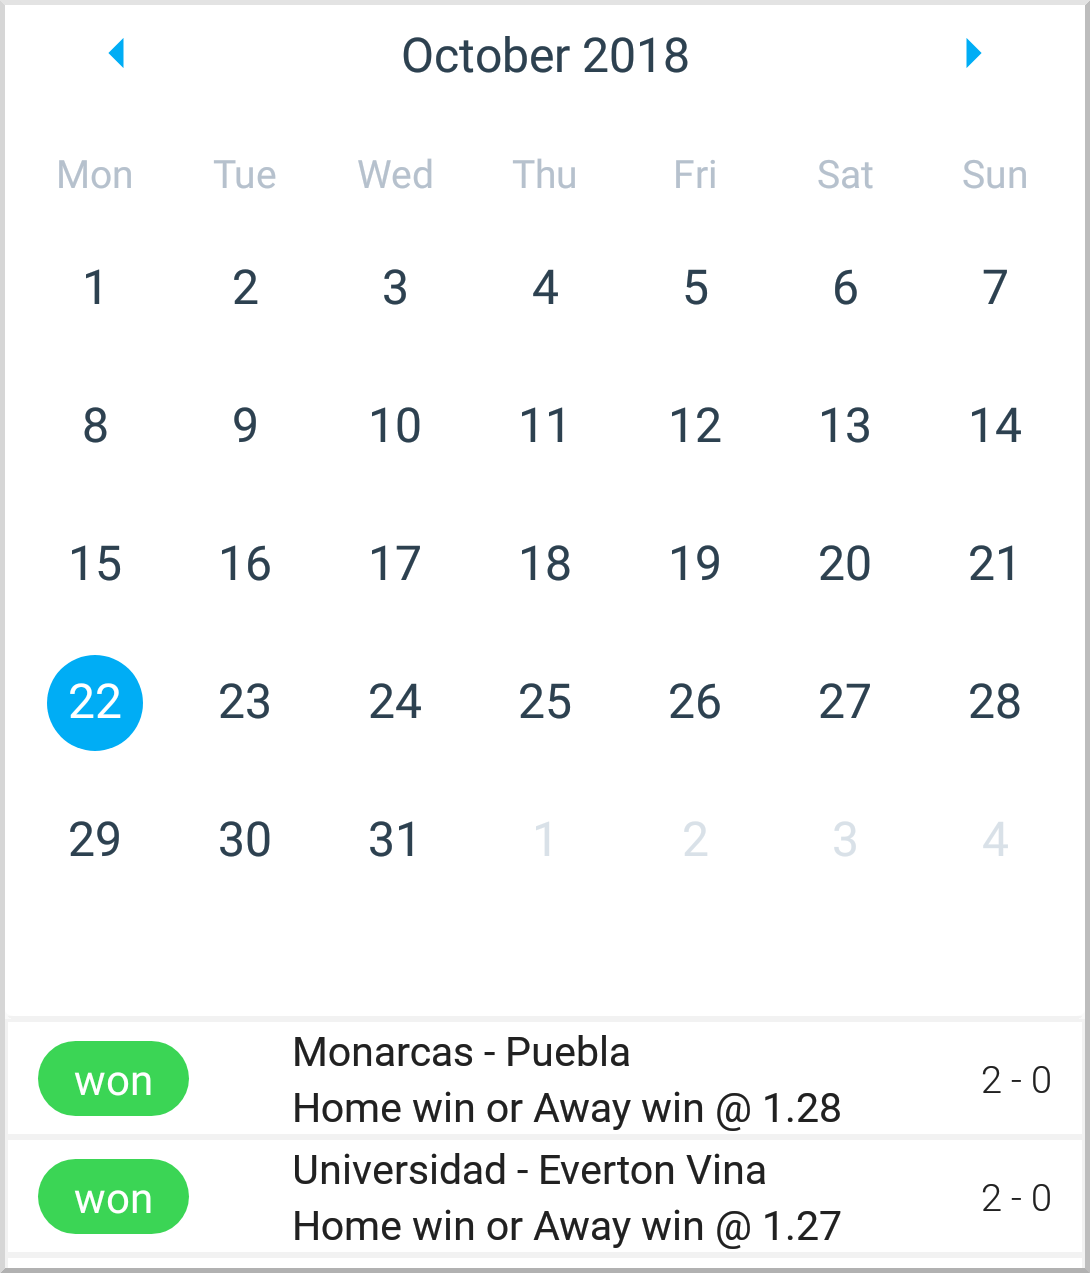
Full history for all predictions and markets
Use the calendar widget to go back in time and see what we predicted for past dates.
Its easy to do so compared to other apps that don't usually allow to see more than 1 day behind.
Cutting-edge statistics
We take about 50-70 factors into consideration when predicting the outcome (depending on the
market)
Historical stats like average goals scored, conceived, clean sheets and many more.
The estimated impact of adversary attack and defence.
Other factors like stadium capacity, field, distance between teams etc.
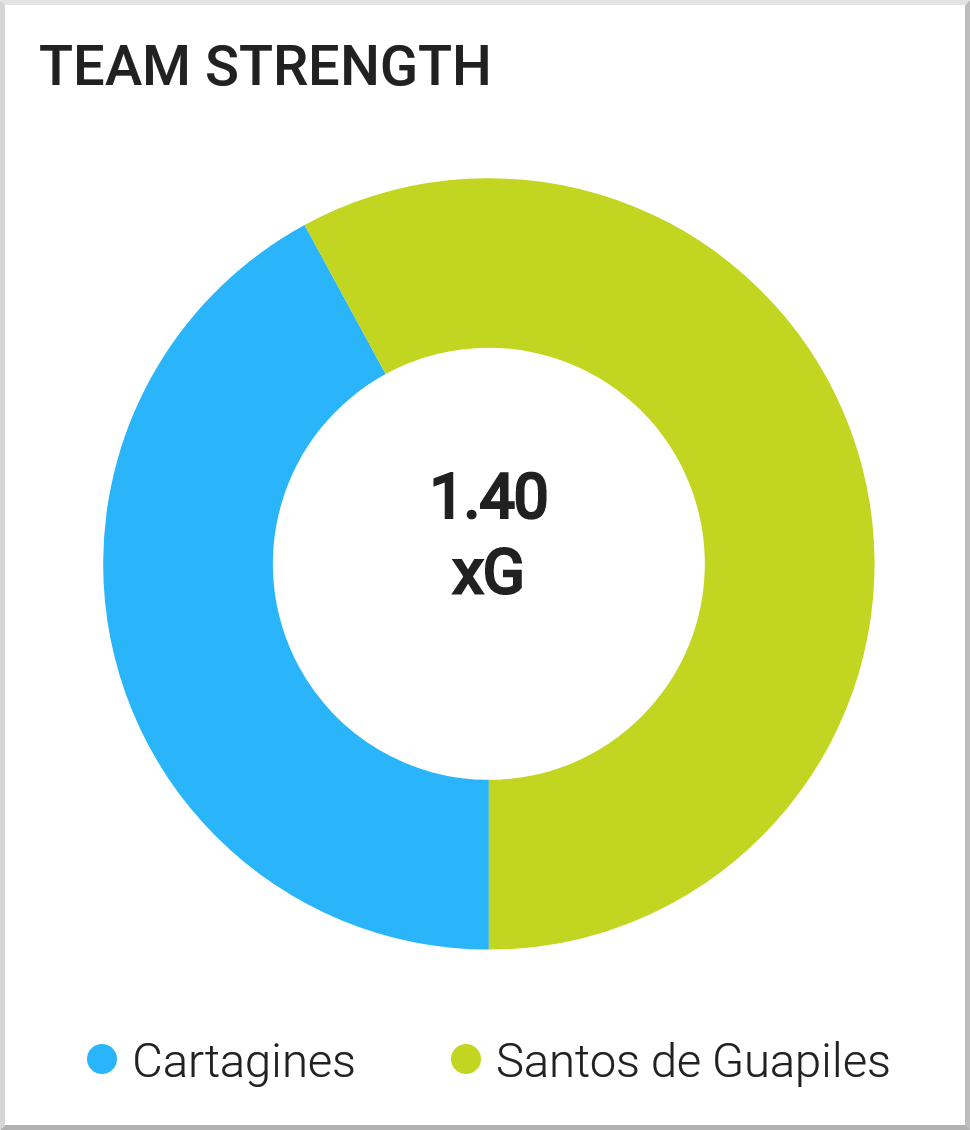
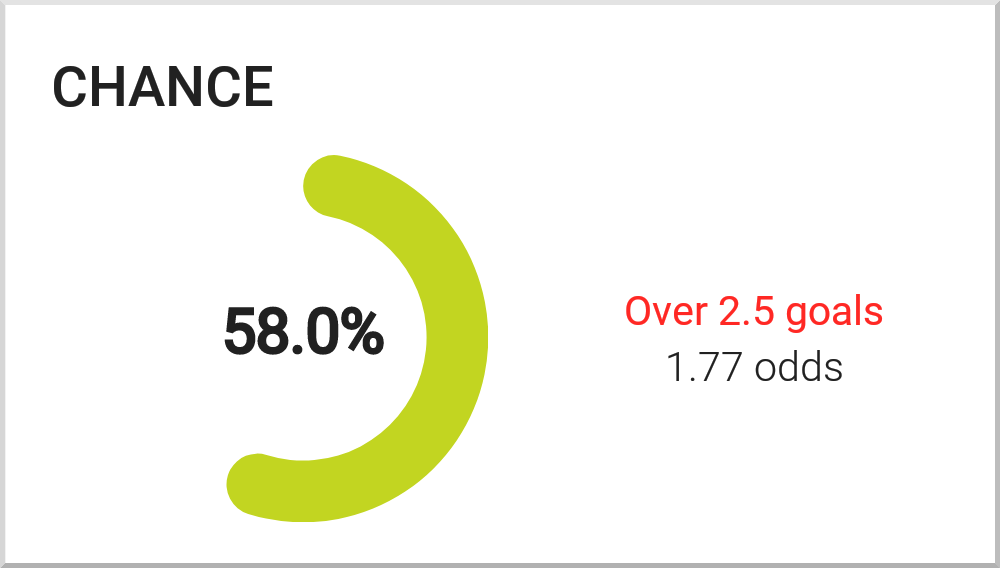
Expected goals
Get a hint on how well the teams are balanced by looking at the expected goals metric.
xG is an index calculated using the attack strength of a team that also takes into consideration the defence strength of the adversary.
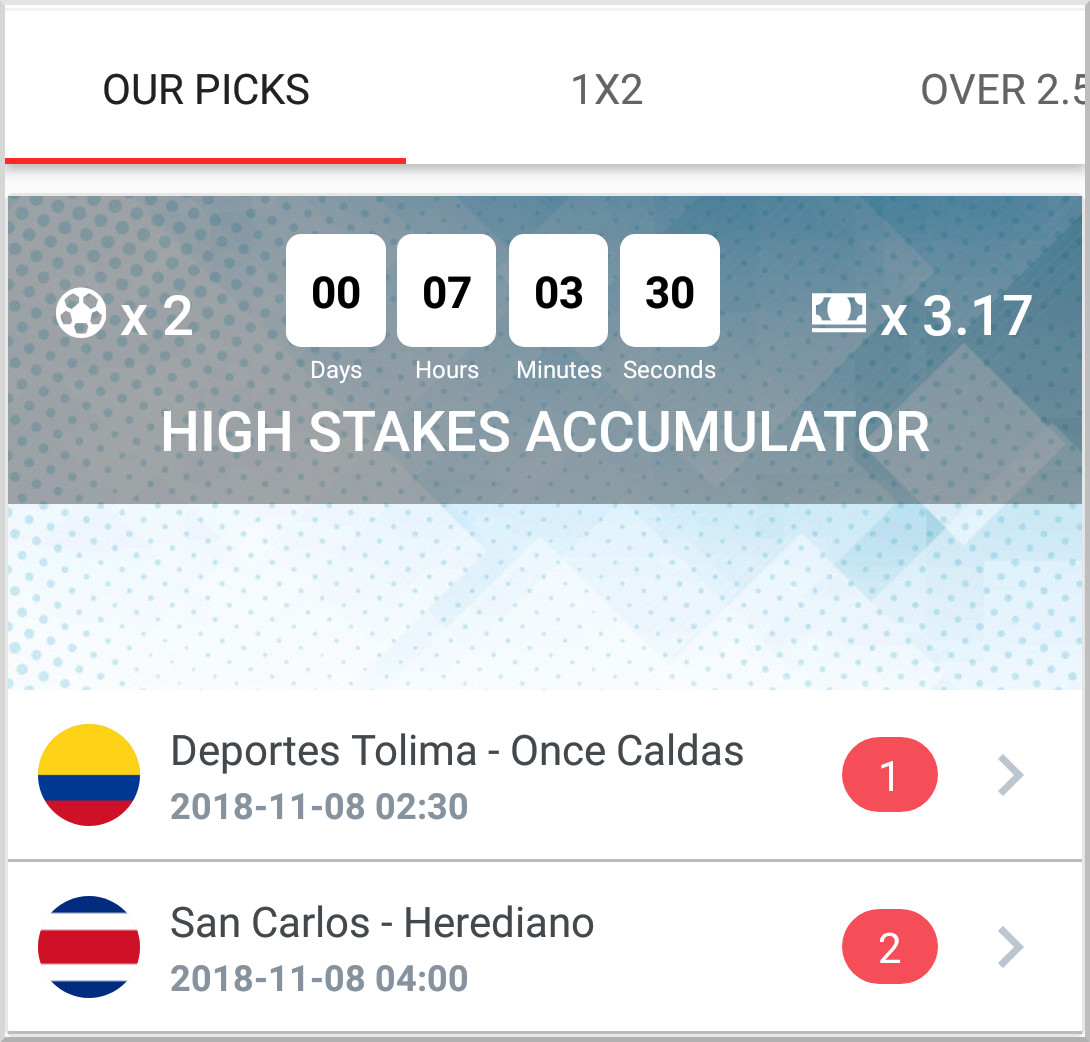
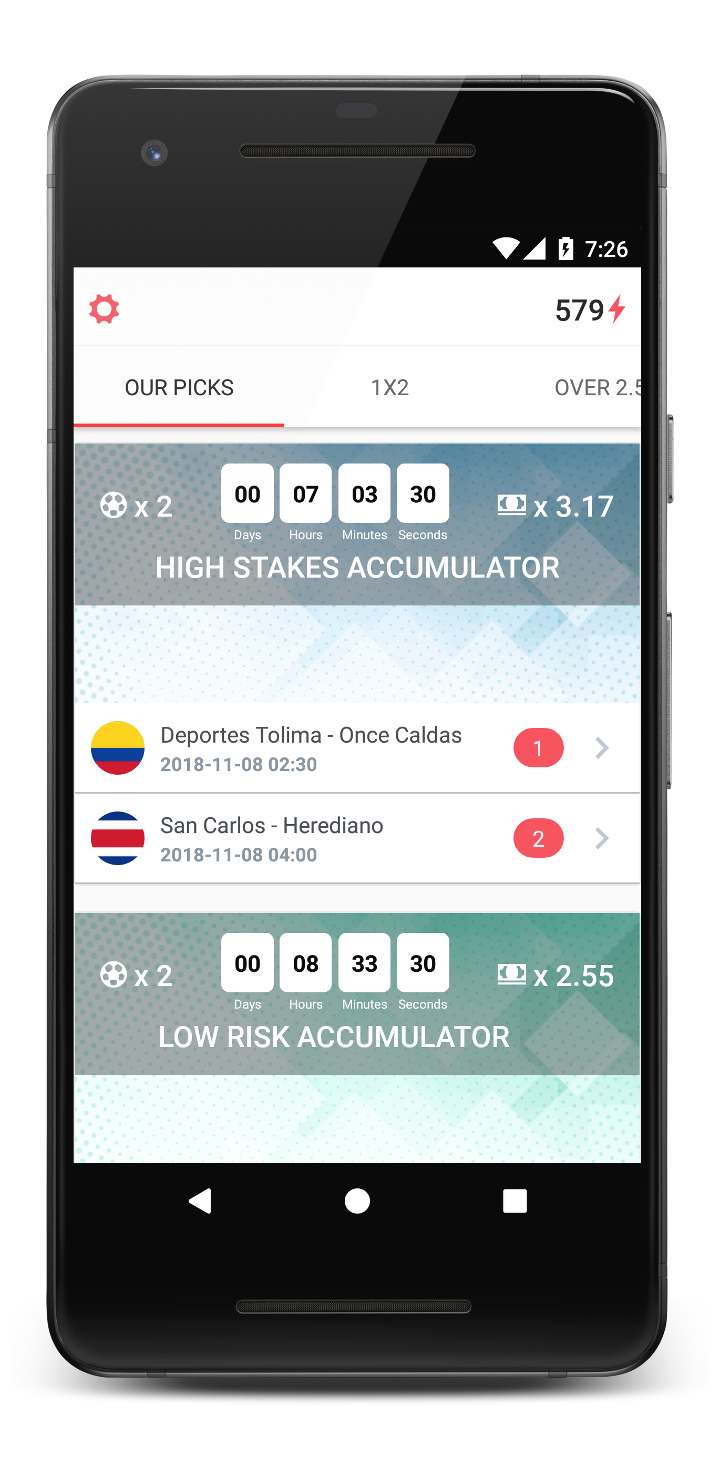
Our picks
Through an optimisation algorithm we pick the bets of the day (doubles and accumulators) by selecting matches with the highest chance of increasing long-term profit.
We determine the best combinations of games that are likely to succeed and recommend only if there is an advantage over the bookmakers.
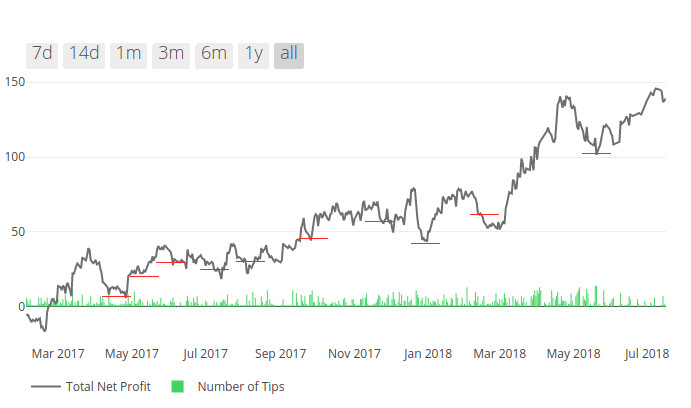
We track the performance of these picks by net profitability which is shown in the Performance Dashboard
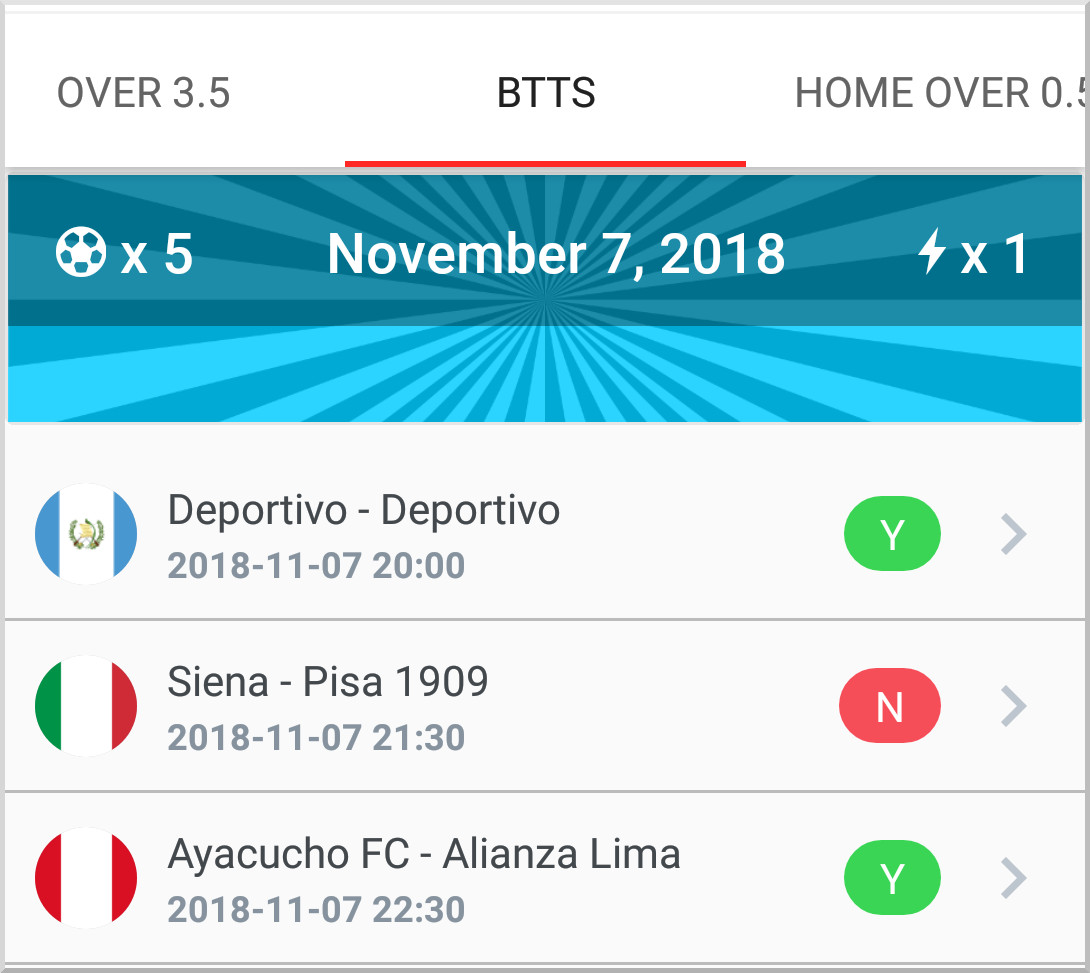
Free tips
Aren't tracked for profitability.
Are already unlocked.
They don't show up on the profitability dashboard.
Maximum 2 per day.
Long-term accuracy not yet available (bet type added in May 2018).
FREE low risk accuracy 56% since May.
Yield at
-3.66% from 50 total suggested bets.
FREE medium risk accuracy 54% since May.
Yield at
1.79% from 51 total suggested bets.
Low risk accumulator
Maximum one per day.
Average suggested odds: 2.615
39 - 40% long-term accuracy.
Yield
at
2.96% from 455 total suggested bets.
High stakes accumulator
Sometimes one game can appear on multiple tips (great value match).
Average suggested odds: 3.5
Not always available.
31% - 32% long-term accuracy.
Yield
at
10.38% from 985 total suggested bets.
Unexpected result
Betting against the favourite.
Average suggested odds: 2.7
38-39% long-term accuracy.
Yield
at
4.32% from 220 total suggested bets.
-
1
Our approach
A quick test
- Check the two tables bellow
- Consider each row a bet placed with a fixed stake of 1 unit
- Which one is better?
Ticket Number Odds Won Bet Amount Wins 1 1.1 YES $1 $1.1 2 1.4 YES $1 $1.4 3 1.5 YES $1 $1.5 4 1.1 YES $1 $1.1 5 1.6 NO $1 $0 6 1.1 YES $1 $1.1 7 1.2 YES $1 $1.2 8 1.45 NO $1 $0 9 1.15 YES $1 $1.15 10 1.1 YES $1 $1.1 TOTALS 8 out of 10 $10 $9.65 Ticket Number Odds Won Bet Amount Wins 1 3.5 NO $1 $0 2 2.7 YES $1 $2.7 3 3.5 YES 1$ $3.5 4 3.2 NO $1 $0 5 3.4 NO $1 $0 6 2.6 NO $1 $0 7 3.4 NO $1 $0 8 3.8 NO $1 $0 9 4.2 YES $1 $4.2 10 2.75 NO $1 $0 TOTALS 3 out of 10 $10 $10.4 Ticket 1
- First table shows better performance in terms of accuracy (8 out of 10 are correct)
- Even at this high accuracy 80%, we are actually losing money.
- Placing bets according to the first table would inflict a total net loss of $0.35.
- Even though we got so many tickets right, we end up with less money than before starting to bet.
Ticket 2
- 3 out of 10 tickets are correct (bad accuracy)
- Placing bets according to the second table would result in a net profit of $0.4.
- Cashout Football Predictions takes a similar approach where our accuracy is not as important as overall profitability
- Each of our tips is tracked in the performance dashboard by net profitability.
- We consider profitability more important than accuracy.
-
2
Simulator
Use our stake simulator to fine-tune the amount of risk you want to take.
Depending on your preference you can opt for riskier or safer methods.
Recommendation:
- Calculate a fixed bet stake representing 3-5 % of your initial bank. (e.g. 100 if the bank is 2000)
- The simulation page allows you to look back in time and select a start date by clicking and selecting a time interval.
- Make sure that during the selected interval your bankroll does not hit 0.
- The purpose is to learn from past performance and tune your fixed stake so that you don't go bankrupt in the short-term.
- The highest risk in our model of betting is selecting a stake that is too big which leads to losing your whole bankroll before betting on sufficient tips to start seeing profits.
- Use this fixed stake for all your future bets
-
3
General recommendations
- Do not increase the stake especially after a winning streak.
- Check the performance dashboard and avoid betting after a recent spike.
- If you risk more than 5% of your bankroll it is best if you start after a low point.